27. 10. 2023
3 min read
Database monitoring: In search of bottlenecks
Although MVPs often start with a simple codebase and minimal feature sets, database monitoring grows exponentially as projects expand. It becomes vital for maintaining and optimizing performance, ensuring data security, and making informed decisions about business growth and cost efficiency.
Kristián Müller


Database monitoring is an essential practice for software engineering teams seeking to optimize their database performance and identify bottlenecks that can impede system efficiency. Bottlenecks can occur at various points within a database environment, including CPU utilization, disk I/O, memory usage, and query execution.
There exist many tools that are robust and can tackle the task, but PostgreSQL offers a suite of built-in utilities that can be invaluable in this quest. One such indispensable tool is pg_stat_statements, a PostgreSQL extension that provides detailed insights into query performance and resource consumption.
Unlike external monitoring solutions, pg_stat_statements is seamlessly integrated into PostgreSQL, making it easily accessible and highly efficient. This extension not only captures vital information about query execution, including execution times and resource usage but also retains the actual SQL statements themselves. With this granular data at your disposal, you can precisely identify which queries are taxing your database, enabling you to pinpoint and address bottlenecks swiftly.
pg_stat_statements
Since pg_stat_statements isn’t enabled out of the box there are some steps we need to take before we can work with it and discover potential bottlenecks.
Setup
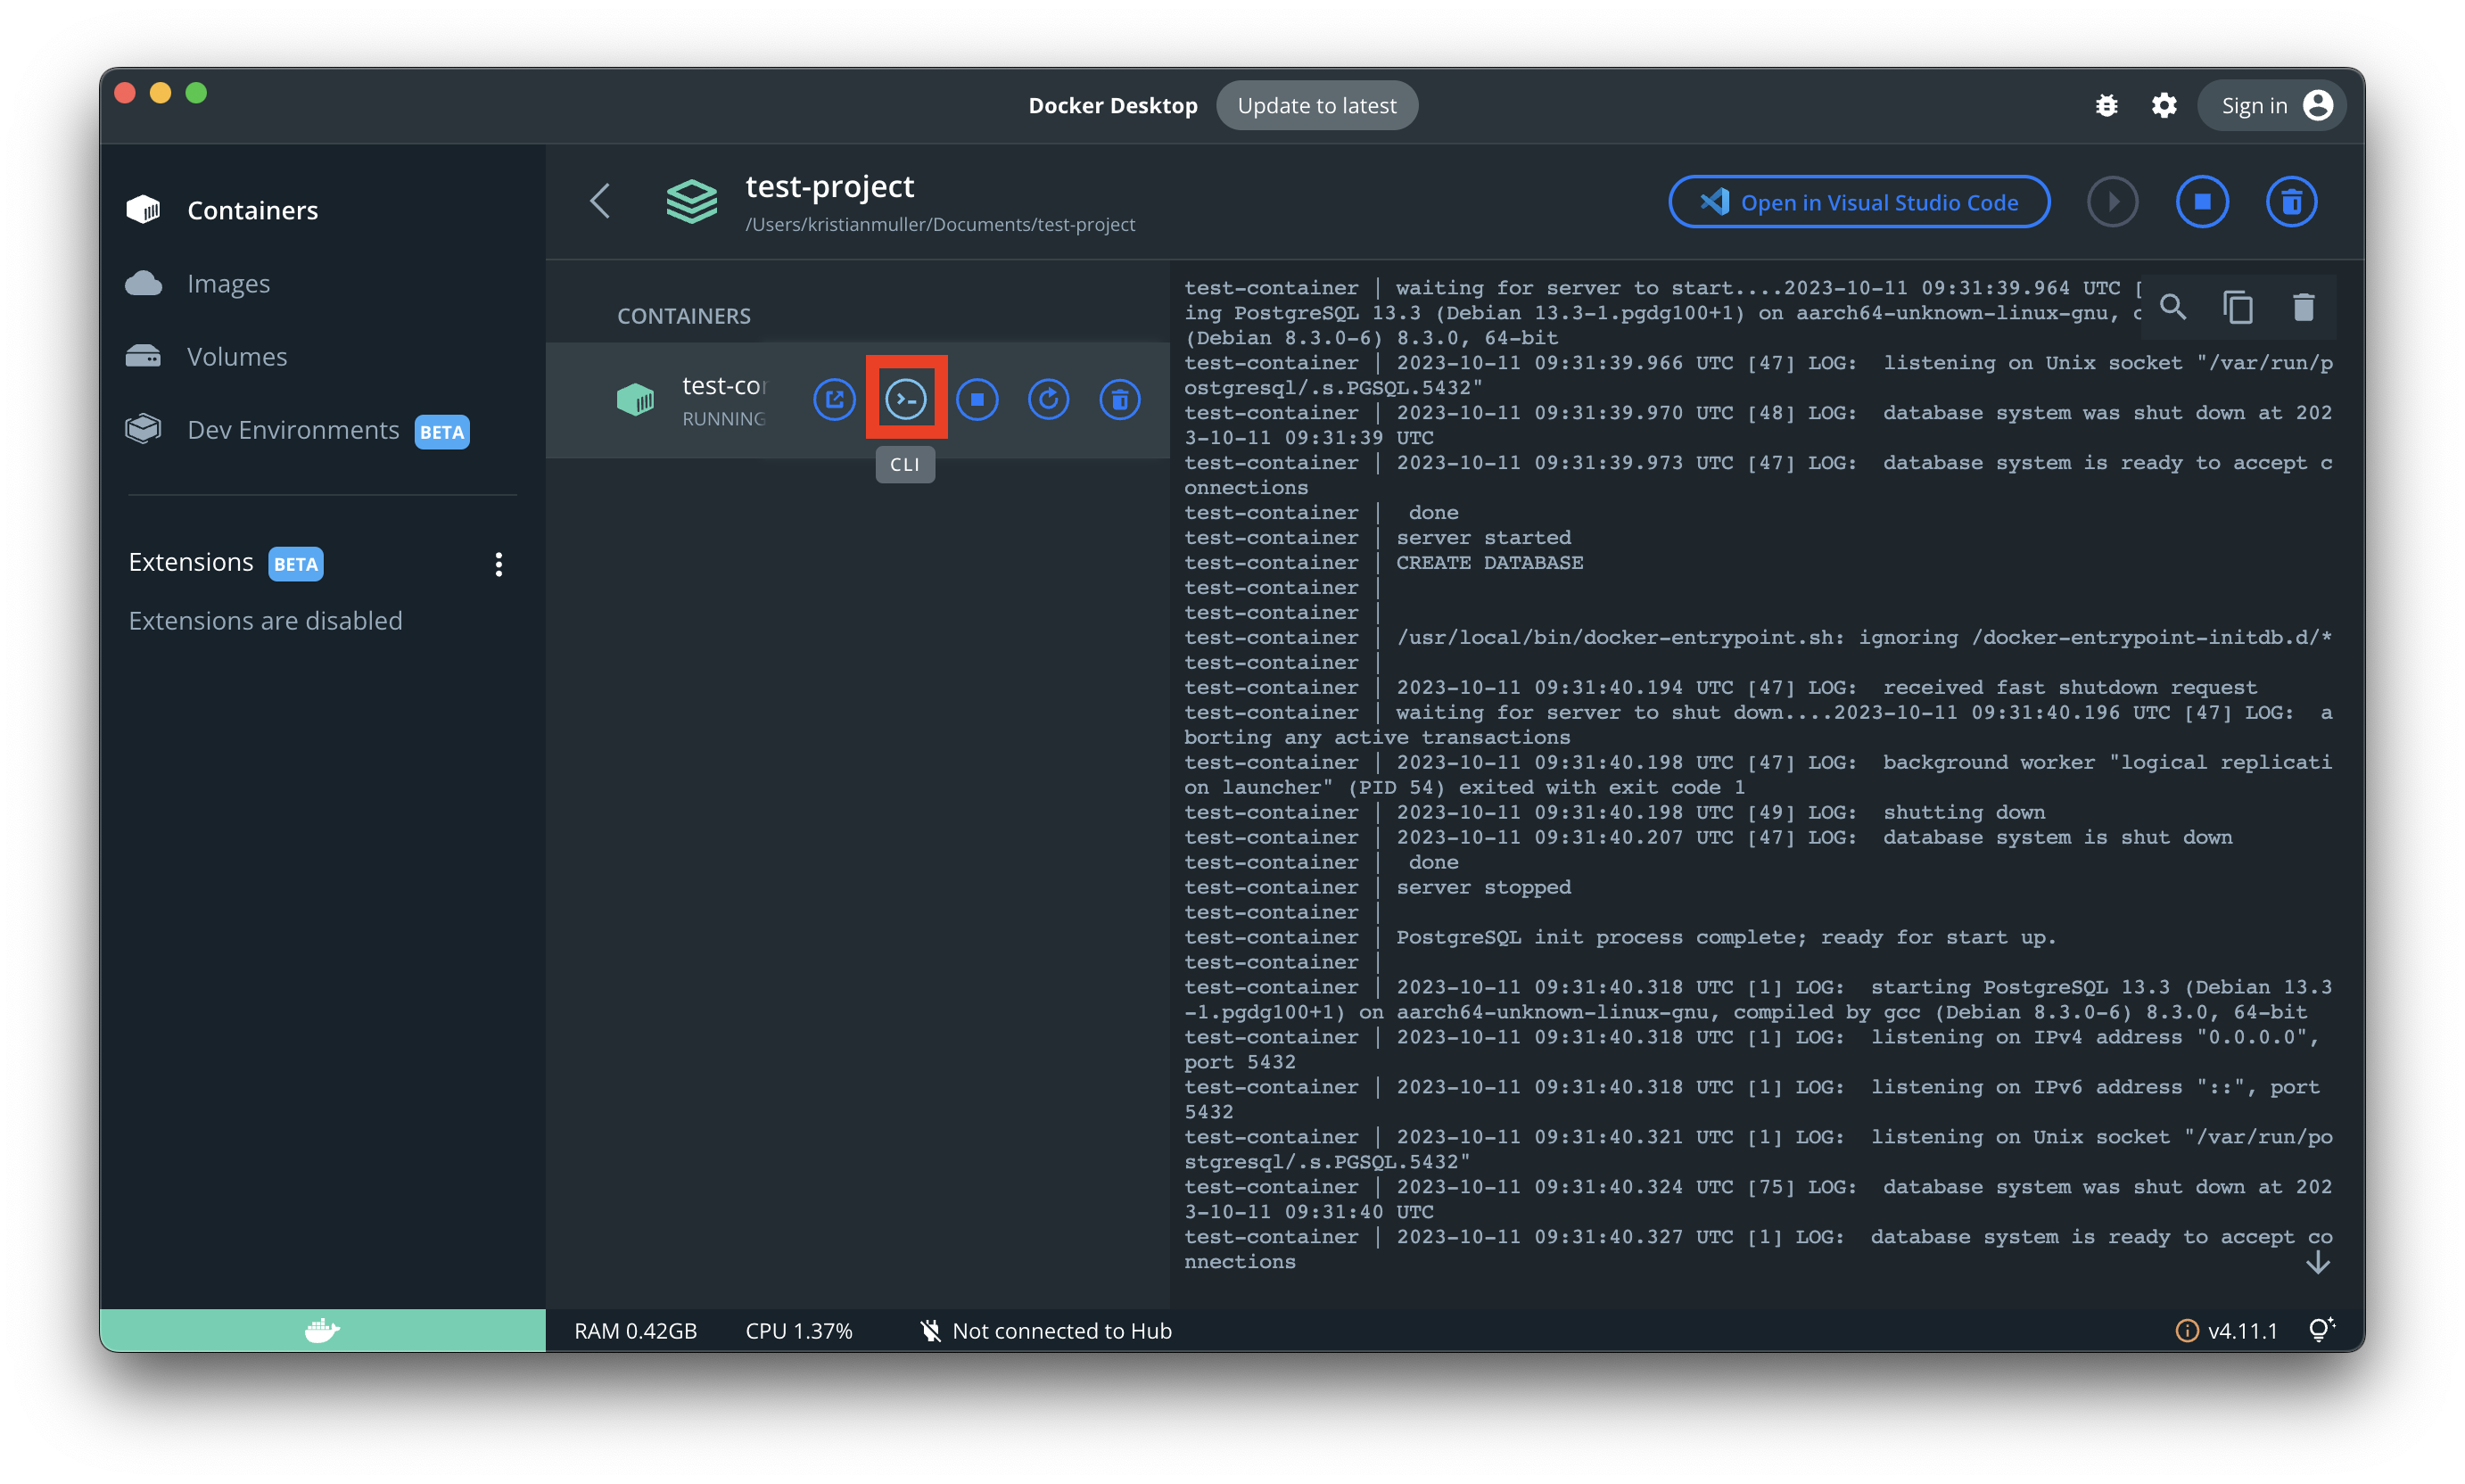
First things first, we need to go into the database docker container console.

$ su - postgres$ cd dataNext, we need to install Vim to be able to edit the postgresql.conf file. For that, we need to run these two commands:
$ apt-get update$ apt-get install vimAfter Vim has been successfully installed we need to run
$ vi postgresql.confand add these settings at the end of the file:
shared_preload_libraries = 'pg_stat_statements'
pg_stat_statements.max = 10000pg_stat_statements.track = all
Last but not least, we need to go into our SQL client and run the following expression:
CREATE EXTENSION pg_stat_statements;Usage
After conducting all the steps above, every query that will be executed in our app will be tracked together with some additional data like calls, total_exec_time, etc. in pg_stat_statements
To inspect all of this information, we will need to run the following query in our SQL client:
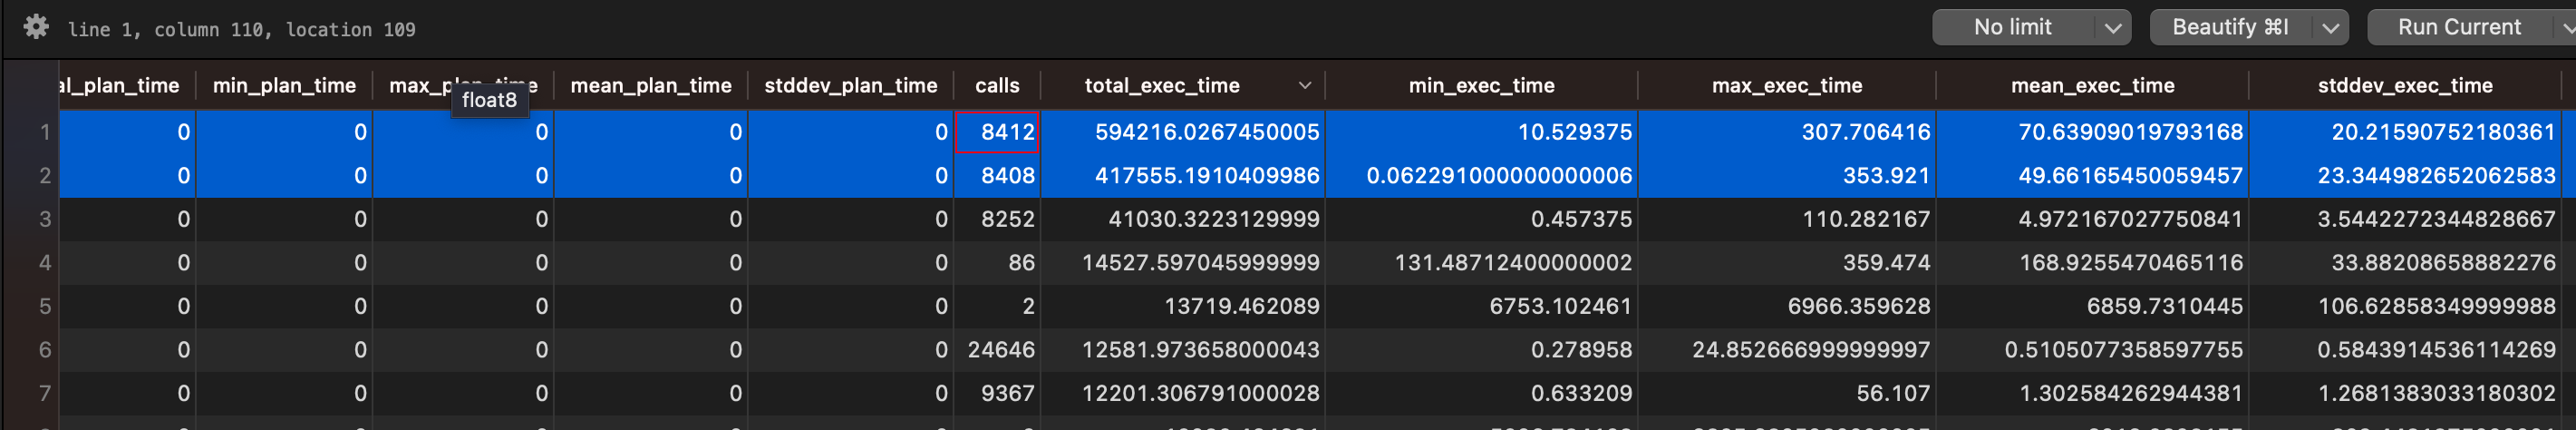
SELECT * FROM pg_stat_statementsWHERE dbid = ( SELECT oid FROM pg_database WHERE datname = 'YOUR_DB_NAME');This will return similar output:
total_exec_time is extremely high compared to other queries. This is a sign that something is off with these queries and further inspection of them is required.

Some of the common issues with unoptimized SQL queries might be:
Missing indexes,
Unnecessary joins,
Suboptimal filter conditions,
Lack of data filtering
Ineffective use of database features.
Why monitoring is key for scaling projects
Monitoring may not be necessary for MVPs due to the limited codebase or feature growth, but it becomes increasingly important as projects scale up.
Database monitoring for scale-up projects can offer several significant advantages, including:
Improved Performance: Database monitoring allows you to identify and address performance bottlenecks and inefficiencies, ensuring that your application runs smoothly even as it scales up.
Cost Savings: By optimizing queries and resource usage, you can reduce operational costs associated with database infrastructure and hosting, potentially saving money on hardware and cloud services.
Enhanced User Experience: Monitoring helps maintain a responsive and reliable application, providing a positive experience for users as your project gains traction.